- TOP
- Investor Relations
- Financial Highlights
Investor Relations
Financial Highlights
Most recent financial results & related information| FY2023 | FY2024 | FY2025 | FY2026 | FY2027 (Forecast) |
|
|---|---|---|---|---|---|
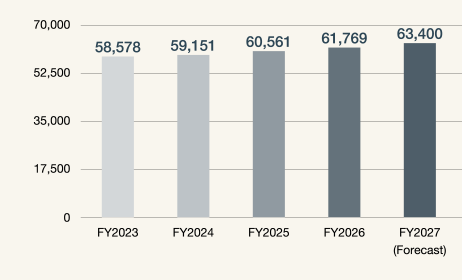
| Net sales(Millions of yen) | 58,578 | 59,151 | 60,561 | 61,769 | 63,400 |
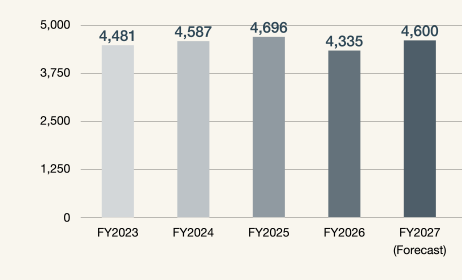
| Operating profit(Millions of yen) | 4,481 | 4,587 | 4,696 | 4,335 | 4,600 |
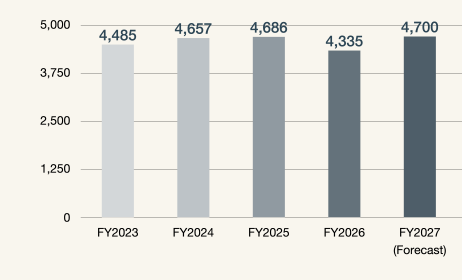
| Ordinary profit(Millions of yen) | 4,485 | 4,657 | 4,686 | 4,335 | 4,700 |
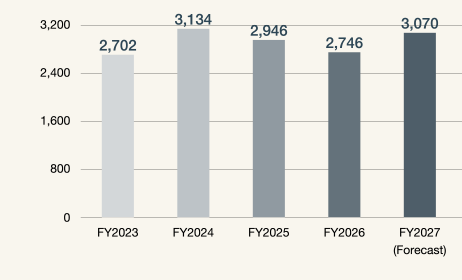
| Profit attributable to owners of parent(Millions of yen) | 2,702 | 3,134 | 2,946 | 2,746 | 3,070 |
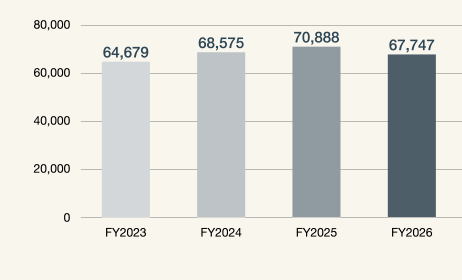
| Total assets(Millions of yen) | 64,679 | 68,575 | 70,888 | 67,747 | ― |
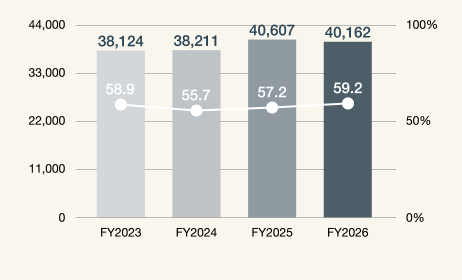
| Net assets(Millions of yen) | 38,124 | 38,211 | 40,607 | 40,162 | ― |
| Net assets per share(Yen) | 1,058.41 | 1,106.37 | 1,175.06 | 1,203 | ― |
| Equity-to-asset ratio(%) | 58.9 | 55.7 | 57.2 | 59.2 | ― |
Net sales(Millions of yen)
Operating profit(Millions of yen)
Ordinary profit(Millions of yen)
Profit attributable
to owners of parent(Millions of yen)
Total assets(Millions of yen)
Net assets /
Equity-to-asset ratio(Millions of yen)